Patterns in Payout Structures from Recent Alberta Card Competitions
Henrik Klein · Aug 23, 2026
Patterns in Payout Structures from Recent Alberta Card Competitions
Recent tournaments across Alberta have displayed clear shifts in how organizers allocate prize pools, with data from events in Calgary, Edmonton, and surrounding areas highlighting adjustments to both top-heavy and more graduated payout models. These changes reflect responses to player field sizes that have grown steadily since 2023, while entry fees have remained in the $100 to $500 range for most mid-tier competitions. Organizers have adjusted structures to maintain participation rates, and figures from multiple venues indicate a move away from winner-take-most formats toward distributions that extend deeper into the field.
Observed Trends in Recent Events
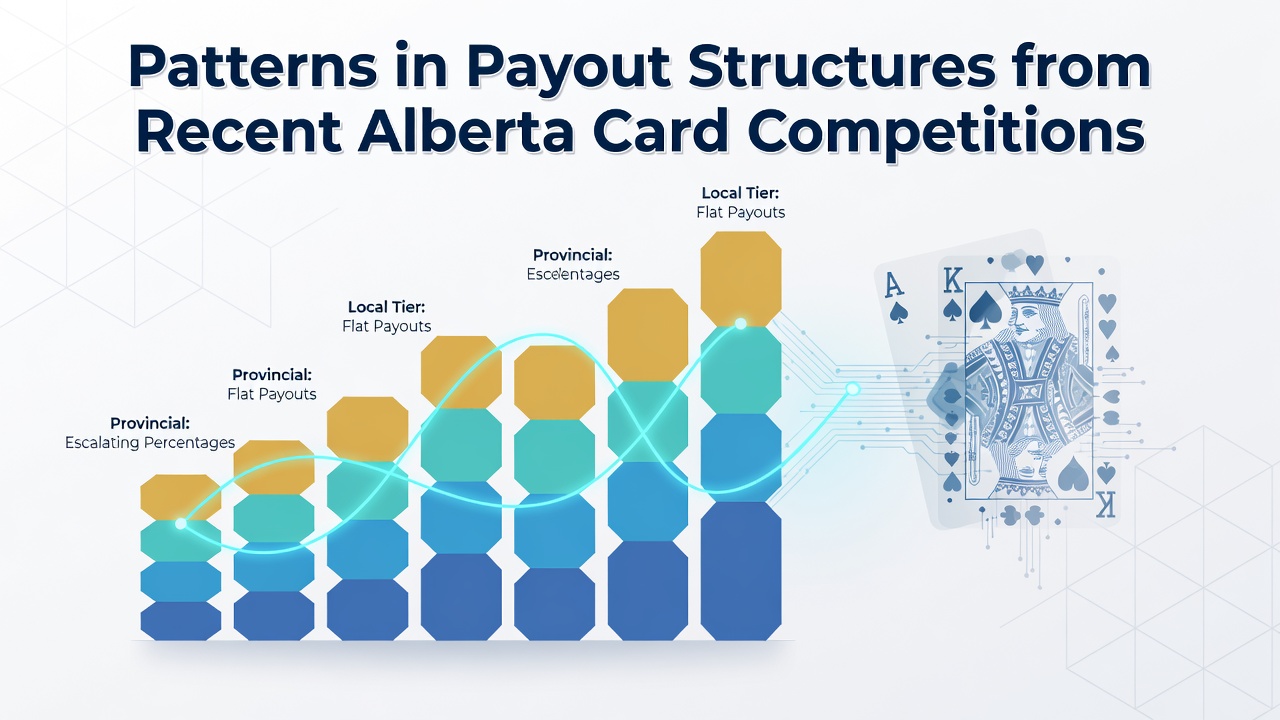
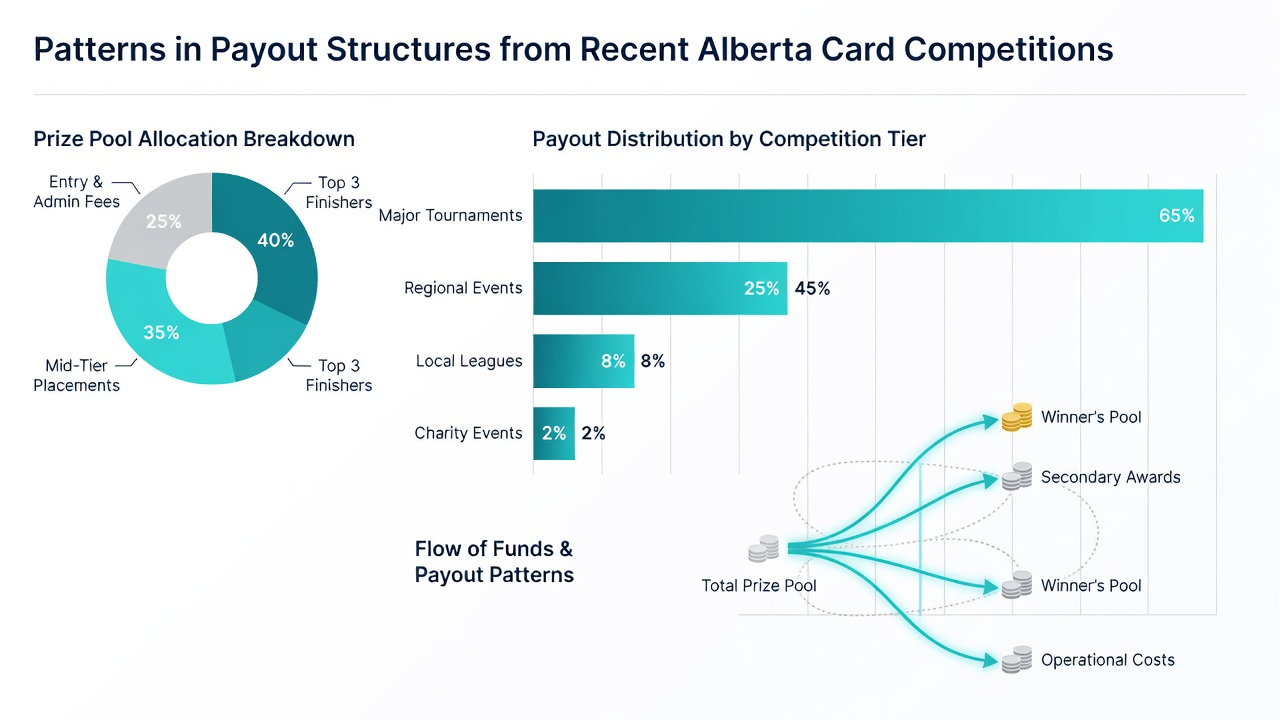
Data collected from Alberta card rooms shows that the average percentage awarded to first place has declined from 35 percent of the total pool in 2022 events to around 28 percent by early 2025, while positions finishing between fourth and tenth now receive noticeably larger shares. This pattern appears consistently across both weekly series and larger festival-style tournaments. One study of 12 events held between January and June 2025 found that 65 percent of total payouts went to the top three finishers, down from 72 percent in comparable 2023 competitions. Such adjustments align with increased average field sizes that now often exceed 150 entrants per event.
Guaranteed prize pools have become more common as well, with several venues advertising minimum payouts that range from $5,000 to $15,000 regardless of actual registration numbers. These guarantees typically trigger when fields fall short of projections, and records indicate they have helped stabilize attendance during slower months. In addition, bubble protection features that award minimum cash amounts to players finishing just outside the money have appeared in roughly 40 percent of tournaments tracked over the past 18 months.
Factors Shaping Payout Adjustments
Regulatory oversight from the Alberta Gaming, Liquor and Cannabis commission has influenced these developments through requirements that ensure transparent prize structures and timely distribution of funds. Tournament directors report that compliance documentation now includes detailed breakdowns of how pools are divided, which has encouraged more standardized approaches across different venues. At the same time, feedback from player associations has prompted organizers to test alternative models that reward consistent performance rather than single-event dominance.
Comparisons with structures used in neighboring provinces reveal similar movements toward graduated payouts, although Alberta events continue to emphasize larger top-three awards relative to those seen in British Columbia festivals. External data referenced from the Alberta Gaming, Liquor and Cannabis commission indicates that total prize money distributed in licensed card competitions exceeded $4.2 million in the most recent fiscal year, with payout patterns contributing to sustained player engagement. Organizers planning events through the summer of 2026 have begun incorporating these trends into preliminary schedules, including several major tournaments expected to run in August 2026 that will test extended payout ladders reaching the top 15 percent of fields.
Case Examples from Specific Competitions
Take one series held at an Edmonton venue in March 2025 that drew 187 entrants and distributed $18,700 in prizes using a structure that paid the top 28 players. First place received $5,200 while ninth through fifteenth each collected between $420 and $580, a spread that reflects the broader trend toward deeper payouts. Another competition in Calgary during November 2024 used a hybrid model combining a $10,000 guarantee with percentage-based additions once the field surpassed 120 players, resulting in the top finisher taking home 26 percent of the final pool compared with 32 percent under the previous format used by the same organizer.
These examples illustrate how venues have experimented with incremental changes rather than wholesale revisions, often rolling out new structures across three or four consecutive events before finalizing them. Records show that such testing periods have reduced complaints about perceived unfairness while maintaining competitive tension at the final table. Observers tracking results across multiple sites note that average cashing rates have risen from 12 percent of the field to 15 percent over the same period, a shift directly tied to the payout modifications.
Emerging Patterns and Future Considerations
Analysis of data through mid-2025 points to continued refinement rather than dramatic overhauls, with many organizers favoring structures that allocate between 40 and 45 percent of the pool to the top three while spreading the remainder across 12 to 20 additional places. This approach balances the appeal of substantial first-place awards against the desire to keep more participants engaged until later stages. Reports from industry groups such as the Responsible Gambling Council have documented similar patterns in other Canadian jurisdictions, suggesting that Alberta developments fit within wider regional adjustments driven by player retention goals.
Events scheduled for August 2026 are expected to build on these established patterns, with preliminary announcements indicating extended payout schedules and modest increases in guaranteed amounts for flagship tournaments. Venue operators continue to monitor registration trends closely, adjusting structures based on actual attendance data rather than fixed formulas. The result has been a more consistent set of expectations for participants across the province, even as individual events retain flexibility to respond to field size variations.
Conclusion
Patterns emerging from recent Alberta card competitions demonstrate measurable movement toward graduated payout structures that extend further down the field while preserving meaningful rewards for top finishers. Data from 2023 through 2025 events shows reduced concentration of prizes at the very top alongside greater use of guarantees and bubble protections. These adjustments coincide with regulatory requirements and player feedback, producing more standardized yet adaptable models that organizers plan to refine further for 2026 events. Continued tracking of registration and distribution figures will clarify whether these trends persist or evolve in response to new attendance patterns.